The cheapest running track quotation is not always the lowest-cost track.An initial price may exclude base correction, freight, import duties, weather delays, accredited testing, local repairs, professional cleaning, line re-marking, resurfacing, lost facility revenue or end-of-life disposal. Two systems with different scopes and maintenance cycles cannot be compared responsibly using only a price per square metre.This guide explains how to calculate the total cost of ownership of a prefabricated rubber running track and a cast-in-place polyurethane track over a common analysis period. It includes formulas, an input table, a normalised example and questions to ask suppliers.It does not publish a universal “running track cost per m²”. Labour, freight, taxes, climate, base condition, competition level, area and project risk vary too widely. The correct calculator uses local, dated and documented inputs.
![]()
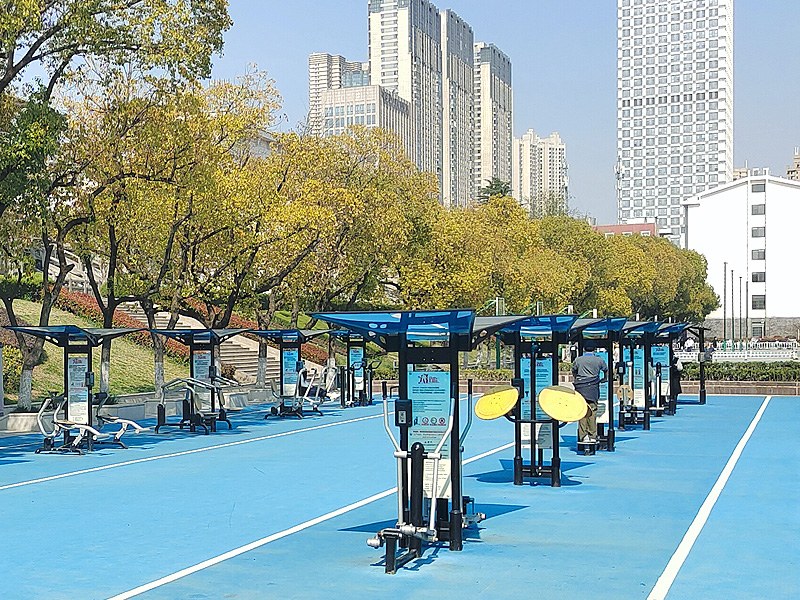
Lifecycle value should be measured against actual utilisation, performance requirements and the cost of keeping the facility available.
1. Define the Systems Before Comparing Cost
Do not compare “rubber” with “PU” as if those terms describe two standard products.
Prefabricated rubber running track
A factory-manufactured rubber sheet or roll is produced to controlled thickness and performance, transported to site and bonded to an engineered base. The system is normally impervious and relies on designed crossfall and drainage.
Cast-in-place track
This category may include:
• Full-pour or solid polyurethane.
• Sandwich/hybrid polyurethane.
• Porous polyurethane base mat with spray coating.
• Other locally produced multi-layer systems.
Each has different material content, labour, cure, porosity, resurfacing options and maintenance. A lifecycle comparison must state the exact layer build-up and performance level of each option.
Sport England's athletics design guidance describes factory-produced prefabricated sheets as offering consistency in resilience and thickness and notes that they tend to be longer lasting with lower maintenance costs, while also requiring a finely engineered base and a reliable adhesive bond. These are tendencies, not a guarantee for every project. See the Sport England Athletics Design Guidance Note .
2. Choose a Common Analysis Basis
All options must use the same:
• Track area in square metres.
• Facility geometry and event sites.
• Performance and certification objective.
• Base condition and civil-work boundary.
• Currency and price date.
• Tax and duty treatment.
• Analysis period, typically selected by the owner.
• Real or nominal discount rate.
• Inflation treatment.
• Annual utilisation.
• Maintenance performance standard.
• Treatment of residual value and disposal.
If one offer includes a new asphalt base and the other starts above an accepted base, separate the civil works from surface-system costs before comparison.
3. Cost Categories the Calculator Must Include
A. Pre-construction and design
• Site survey and geotechnical work.
• Track geometry and event-site design.
• Drainage design.
• Technical consultancy.
• Tender preparation.
• Samples, mock-ups and trials.
• Certification planning and laboratory coordination.
B. Base and civil works
• Demolition and disposal of the old surface.
• Formation and sub-base correction.
• Drainage channels, pipes and outlets.
• Asphalt or concrete base.
• Grinding and local level correction.
• Crack and joint treatment.
• Moisture mitigation.
• Survey and water testing.
C. Surface supply
• Surface material.
• Primer, adhesive, binder and repair materials.
• Line-marking paint.
• Local thickening and special event areas.
• Factory testing and certificates.
• Packaging, loading and spares.
D. Logistics and import
• Inland transport to port.
• Export packing and documentation.
• Ocean/air freight.
• Insurance.
• Port, terminal and customs charges.
• Import duty and unrecoverable tax.
• Inland delivery and unloading.
• Storage and climate control.
• Currency and price-escalation allowance.
E. Installation
• Specialist labour.
• Supervisor travel, visas and accommodation.
• Local labour and equipment.
• Surface preparation.
• Adhesive mixing and application.
• Roll/layer installation.
• Seam, edge and transition work.
• Curing and protection.
• Line marking.
• Waste handling and site cleaning.
F. Quality, measurement and certification
• Quality-control staff.
• Base and material testing.
• Track survey and measurement report.
• Accredited laboratory field testing.
• Certification application and fees.
• Retesting and corrective work allowance.
G. Operating and maintenance
• Routine cleaning labour and equipment.
• Professional deep cleaning.
• Drain and channel maintenance.
• Line re-marking.
• Local seam, edge and high-wear repairs.
• Surface retexturing or re-topping.
• Technical inspections.
• Temporary protection for non-athletics events.
H. Downtime and disruption
• Lost facility hire or event revenue.
• Relocation of training and competitions.
• School timetable disruption.
• Temporary facility rental.
• Event penalties or reputational cost.
• Mobilisation cost for repeat repair visits.
I. Risk-adjusted costs
• Weather-related installation delay.
• Material waste or site-mixing variability.
• Base rejection and correction.
• Adhesion failure or moisture damage.
• Certification retest.
• Freight delay or damaged materials.
• Currency movement.
• Contractor insolvency or unavailable local service.
J. End-of-life
• Removal.
• Segregation and transport.
• Disposal or recycling fees.
• Base repair for the replacement system.
• Residual/reuse value, if demonstrable.
• Replacement surface and renewed certification.
![]()
The value model should reflect the facility's real use pattern, including public access, operating hours and maintenance demand.
4. Core Formulas
4.1 Initial installed cost
Initial Installed Cost
= Design and Pre-construction
+ Base and Civil Works
+ Surface Supply
+ Freight, Duty and Logistics
+ Installation
+ Testing and Certification
+ Contingency |
4.2 Annual routine cost
Annual Routine Cost
= Routine Cleaning
+ Drainage Maintenance
+ Inspection
+ Small Repairs
+ Facility Protection |
4.3 Expected risk cost
For each risk:
Expected Risk Cost = Probability of Event × Financial Impact |
Example: if the documented probability of a weather delay is 20% and the estimated impact is 30,000 currency units, the expected cost is 6,000. Do not invent the probability; use historical project data, local weather windows and contractor records.
4.4 Present value of a future cost
PV of Cost at Year t = Cost at Year t ÷ (1 + r)^t |
Where:
• PV = present value.
• r = discount rate per year.
• t = year in which the cost occurs.
Use a real discount rate with constant-price inputs, or a nominal discount rate with inflated future cash flows. Do not mix the two.
4.5 Total lifecycle cost
Lifecycle Cost
= Initial Installed Cost
+ PV of Routine Maintenance
+ PV of Periodic Cleaning and Re-marking
+ PV of Repairs and Resurfacing
+ PV of Downtime
+ PV of Risk-Adjusted Costs
+ PV of End-of-Life Cost
− PV of Residual Value |
4.6 Equivalent annual cost
Equivalent annual cost allows options with the same analysis period to be expressed as an annual burden:
EAC = NPV × [r(1+r)^n] ÷ [(1+r)^n − 1] |
Where n is the analysis period in years.
![]()
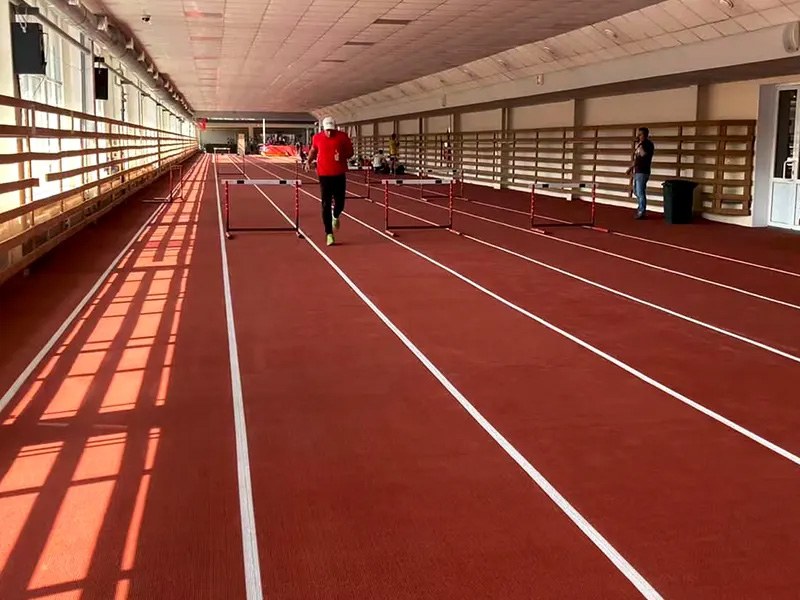
Indoor and outdoor venues can have different weather exposure, access, maintenance and downtime assumptions in a lifecycle model.
4.7 Cost per use
Cost per Athlete-Hour = Equivalent Annual Cost ÷ Annual Athlete-Hours |
For a commercial stadium, a complementary measure is cost per available event day.
5. Calculator Input Sheet
Enter one column for each proposed system.
Project assumptions
| Input | Prefabricated system | Cast-in-place system | Source/date |
Area (m²) |
|
| Drawing |
|
Currency |
|
| Employer |
|
Price date |
|
| Employer |
|
Analysis period (years) |
|
| Owner policy |
|
Discount rate |
|
| Finance team |
|
Annual athlete-hours |
|
| Operator |
|
Downtime value per day |
|
| Operator |
|
Certification objective |
|
| Employer |
|
Initial costs
| Cost item | Prefabricated | Cast-in-place | Included in bid? | Evidence |
Design and technical support |
|
|
|
|
|
Base construction/correction |
|
|
|
|
|
Surface materials |
|
|
|
|
|
Adhesive/binder/primer |
|
|
|
|
|
Freight and insurance |
|
|
|
|
|
Duty and local charges |
|
|
|
|
|
Specialist installation |
|
|
|
|
|
Local labour/equipment |
|
|
|
|
|
Line marking |
|
|
|
|
|
Testing and certification |
|
|
|
|
|
Opening spares |
|
|
|
|
|
Contingency |
|
|
|
|
|
Recurring and periodic costs
| Cost event | Amount — prefab | Year(s) — prefab | Amount — cast-in-place | Year(s) — cast-in-place |
Routine annual maintenance |
| 1…n |
| 1…n |
|
Professional cleaning |
|
|
|
|
|
Re-marking |
|
|
|
|
|
Local repair |
|
|
|
|
|
Retexture/re-top |
|
|
|
|
|
Major resurfacing |
|
|
|
|
|
Field retesting |
|
|
|
|
|
End-of-life removal |
| n |
| n |
|
Residual value |
| n |
| n |
|
Risk register
| Risk | Probability | Impact | Expected cost | Owner/mitigation |
Base fails acceptance |
|
|
|
|
|
Installation weather delay |
|
|
|
|
|
Freight delay/damage |
|
|
|
|
|
Certification retest |
|
|
|
|
|
Premature local repair |
|
|
|
|
|
Currency escalation |
|
|
|
|
|
Event downtime |
|
|
|
|
|
6. Normalised Example: Why Initial Price Can Mislead
The example below uses a cost index per m², not market prices and not a HuadongTrack quotation. Its only purpose is to demonstrate the calculation.
Assumptions:
• 20-year analysis period.
• 4% real discount rate.
• Same accepted base and performance objective.
• Constant-price cost index.
• No residual value.
Illustrative cash-flow inputs
| Cost index item | Prefabricated | Cast-in-place |
Initial installed surface | 135 | 100 |
|
Initial expected risk allowance | 2 | 6 |
|
Routine annual maintenance | 0.6/year | 0.9/year |
|
Professional cleaning | 1.5 in years 3, 6, 9, 12, 15, 18 | 2 in years 3, 6, 9, 12, 15, 18 |
|
Re-marking | 3 in years 7 and 14 | Included in re-top assumption |
|
Local repairs | 5 in year 12 | 4 in years 5, 10 and 15 |
|
Re-top/resurface | None assumed inside model horizon | 25 in years 8 and 16 |
|
End-of-life cost | 4 in year 20 | 6 in year 20 |
|
Using the formula above, the illustrative net present lifecycle cost is approximately:
• Prefabricated option: 160.20 cost-index units/m²
• Cast-in-place option: 168.91 cost-index units/m²
This does not prove that prefabricated systems always cost less. If local prefabricated freight is high, the base requires extensive correction, the in-situ contractor has exceptional quality control, or the selected cast system has a different resurfacing profile, the result can reverse. The model's value is transparency: every disagreement becomes an input to verify rather than a sales claim.

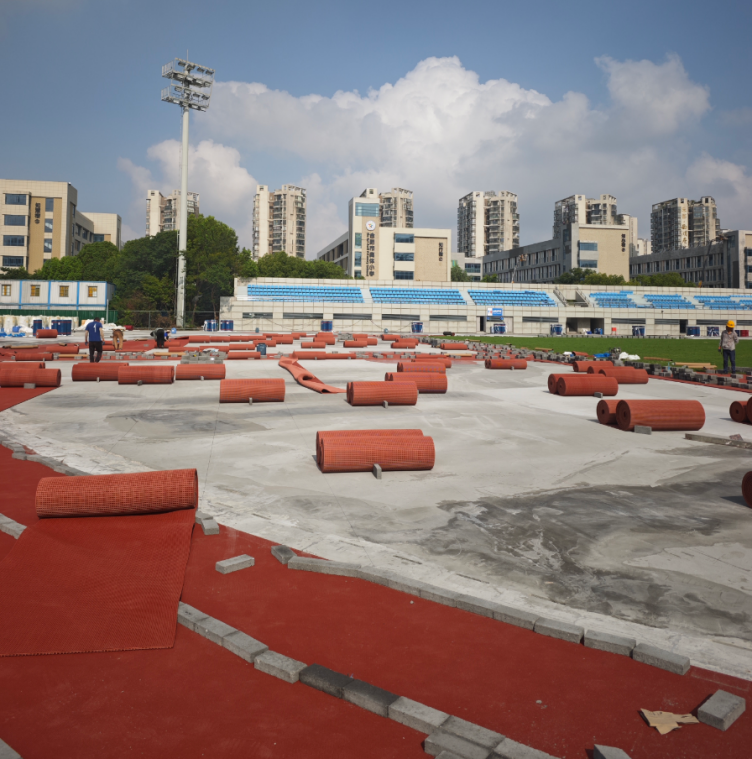
Event use makes downtime measurable: lost training, relocation and interrupted competition should be included in risk-adjusted cost.
7. Sensitivity Analysis: Test the Variables That Can Change the Decision
Do not present one answer. Test at least three scenarios.
Scenario A — Base case
Use the most likely costs and maintenance intervals supported by quotations and references.
Scenario B — Optimistic
Assume favourable weather, no major repairs, on-time freight and maximum expected service intervals.
Scenario C — Downside
Include base correction, delayed opening, earlier repair/resurfacing, currency movement and retesting.
Test these variables individually:
• Initial price premium.
• Analysis period.
• Discount rate.
• Freight and duty.
• Annual usage.
• Professional cleaning frequency.
• Re-marking interval.
• Repair and resurfacing year.
• Facility downtime value.
• Expected life of the accepted base.
• End-of-life removal and disposal.
The break-even question is often more useful than the base result:
At what resurfacing year, downtime cost or maintenance level does Option A become less expensive than Option B? |
8. Questions to Ask Every Supplier
Scope and price
1. Does the price include the base, or start from an accepted base?
2. Which primer, adhesive/binder, line marking and repair materials are included?
3. Are freight, duty, tax, unloading, local equipment and accommodation included?
4. Is technical supervision included, and for how many days?
5. Who pays for survey, accredited testing, certification and retesting?
Maintenance and service life
1. What maintenance schedule is required to keep the warranty valid?
2. Which maintenance activities must be performed by a specialist?
3. What is the expected re-marking, local-repair and resurfacing sequence?
4. Can the supplier show comparable projects after five, ten or more years?
5. Are the stated lifespan and warranty the same? If not, explain each.
Risk and downtime
1. What weather conditions stop installation?
2. What is the planned daily installation output under local conditions?
3. Which defects can be repaired locally, and how visible are repairs?
4. What materials and technicians are available locally after handover?
5. What is excluded if the base moves, cracks or retains moisture?
End-of-life
1. Can the surface be separated from the base?
2. Is a recycling route actually available in the project country?
3. What base preparation will be needed before the next surface?
4. What waste classifications and disposal fees apply locally?
5. Is any residual value supported by a real take-back programme?
9. Common Costing Errors
Error 1: Comparing quotation totals with different scopes
Fix: issue a common scope matrix and require bidders to price exclusions.
Error 2: Treating warranty as service life
Fix: model warranty, expected service interval and analysis period separately.
Error 3: Ignoring the base
Fix: inspect the base before final comparison and price correction as a separate line.
Error 4: Assuming no downtime value
Fix: ask the operator what one lost training day, hire day or event day costs.
Error 5: Counting future costs without discounting
Fix: use finance-approved real or nominal cash-flow treatment consistently.
Error 6: Using supplier marketing intervals as guaranteed outcomes
Fix: verify maintenance and repair assumptions against contracts, technical manuals and comparable aged references.
Error 7: Claiming recycling value without a local route
Fix: obtain a written collection, transport and processing proposal for the project country.
Error 8: Ignoring risk allocation
Fix: model both expected cost and who contractually bears each risk.
Frequently Asked Questions
1.How much does a running track cost per square metre?
There is no responsible global rate. Area, base, surface type, thickness, freight, duty, labour, certification and local site conditions must be defined. A material-only rate is not an installed-project cost.
2.Is a prefabricated running track more expensive?
It may have a higher initial material or installed price in some markets. The lifecycle result depends on base correction, logistics, maintenance, repair, downtime, service interval and end-of-life assumptions.
3.How long does a synthetic running track last?
Life depends on system, UV and climate, usage, spikes, drainage, base movement, installation and maintenance. Use a range supported by project references and test the financial effect of earlier replacement.
4.How often should a track be resurfaced?
There is no universal interval. UK Athletics' surface-type guidance, for example, describes different maintenance and repair patterns by generic system. The manufacturer's manual, condition surveys and performance testing should control the project plan. See the UK Athletics Track Surface Types Factsheet .
5.Should the calculator include the asphalt base?
Yes when the base differs between options or is part of the procurement. If all options use the same accepted base, show it as a common cost and still test the risk of correction.
6.What discount rate should be used?
Use the rate approved by the owner's finance or public-investment policy. State whether inputs are real or nominal.
7.Is maintenance cost only cleaning?
No. Include inspection, drains, lines, local repairs, professional work, surface renewal, access equipment, protection and operator time.
8.How should certification costs be handled?
Include measurement, accredited laboratory work, application, travel, access, testing and possible retesting. Allocate responsibility in the tender.
9.Can a cheaper surface be the better choice?
Yes. If the facility does not require elite competition performance, expected use is low and a competent local system offers suitable durability, the lower-cost option may provide better value. The calculator should support the facility objective, not a predetermined product.
10.What is the best analysis period?
Choose a period that captures the owner's investment horizon and at least one major renewal cycle. Run sensitivity tests with shorter and longer periods.
Decision Rule
Select the system that meets the required performance and certification with the best risk-adjusted lifecycle value—not automatically the lowest initial price or the longest marketing claim.
HuadongTrack offers GOMER, GODER and GOTER prefabricated running track systems with different construction and intended service profiles. Review the product range , then request a project-specific comparison using the same area, base, freight destination, installation scope, certification objective and analysis period for every option.